
2015 PPAI
DISTRIBUTOR SALES VOLUME REPORT
48 •
PPB
• JULY 2016
GROW
CEO of PPAI. “Our growth speaks to the power and effective-
ness of promotional products as a stand-alone marketing tool as
well as part of integrated campaigns where building strong cus-
tomer relationships is key. While many of our larger distributor
respondents fared best with significant double-digit growth,
segments of the small distributor community were flat and
down year over year. I think these results are reflective of the
investments companies will continue to make to deliver an
omni-channel approach to serving the marketplace. Overall, I
am pleased to see our industry continue to show its strength
and value in an uncertain economy.”
The prediction in recent years that large companies would
keep getting bigger and small companies would decline gained
more of a toehold in 2015. The overall number of companies
with sales less than $2.5 million that report promotional prod-
ucts sales declined to 22,153 from 23,025 in 2014. However,
the number of large companies with sales of more than $2.5
million reporting sales remained relatively stable at 868 com-
pared to 872 in 2014. In addition, the total number of U.S. dis-
tributor companies reporting sales in 2015 was 23,021, slightly
down from 23,896 in 2014.
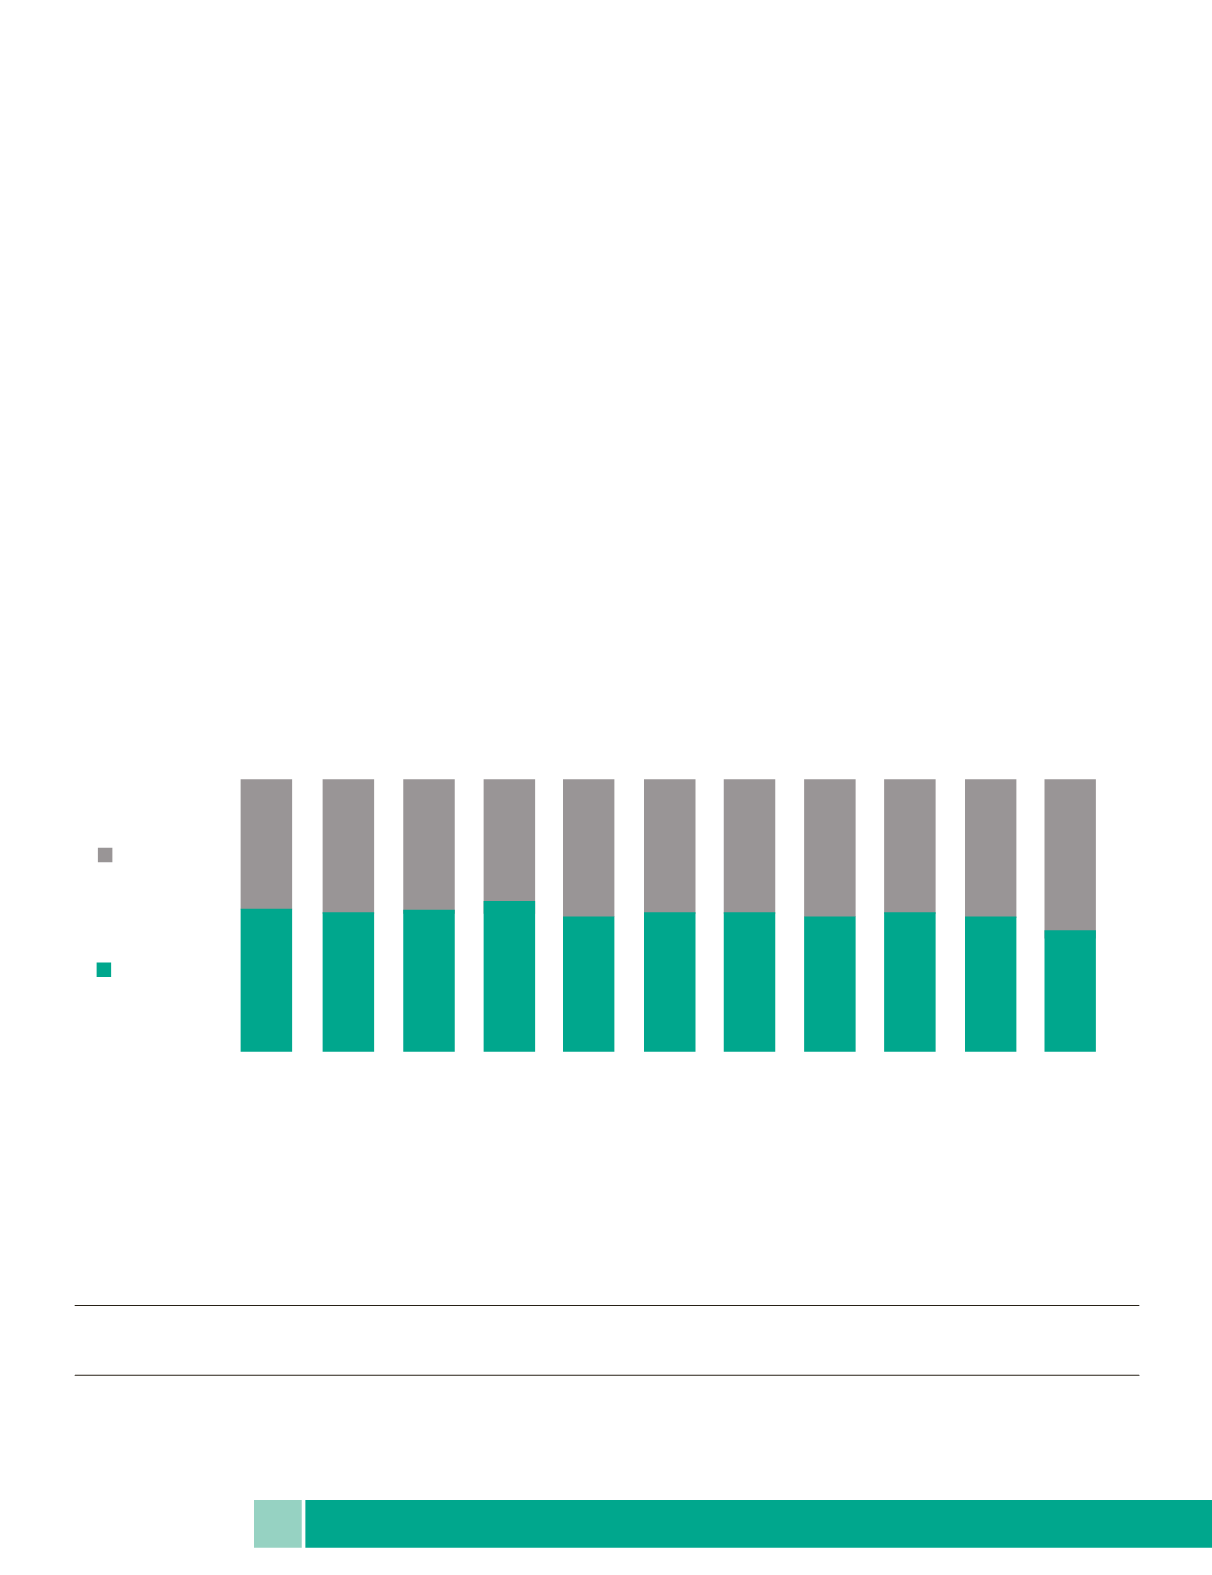
In terms of market share, the 868 firms representing large
companies (sales of $2.5 million or more) captured
$11,551,799,373 of the business—a 55.5-percent share. It
should be noted that the large-company grouping included
franchisors like Adventures in Advertising, Proforma and
iPROMOTEu, and these firms report for their franchisees.
Sales for the smaller distributors as a group amounted to
$9,256,371,349, or 44.5 percent.
For the first time in many years, large distributors accounted
for a larger proportion of the total sales volume than smaller
firms, carving out five additional percentage points of the total
sales performance.
As in 2014, only large companies had positive results by
year-end. Distributors in the $2.5 million-plus bracket recorded
sales of $11.5 billion, showing significant gains at a 14.05 per-
Number Of
% Increase/
Distributor
Distributor 2015 Sales
2014 Sales
Total
Decrease In Sales
Company Size Companies Volume
Volume
Difference
Volume Over 2014
Under $2.5 million
22,153
$9,256,371,349
$9,913,592,681
-$657,221,332 -6.63%
$2.5 million
or over
868
$11,551,799,373
$10,128,636,250
$1,423,163,123 14.05%
Total
23,021
$20,808,170,722
$20,042,228,931
$765,941,791 3.82%
FIG. 3
//
Annual Estimate Of U.S. Distributor Sales In 2015 Vs. 2014
47%
53%
49%
51%
48%
52%
45%
56%
50%
50%
49%
51%
49%
51%
50%
50%
49%
51%
50%
50%
55%
45%
2005 2006 2007 2008 2009 2010 2011 2012 2013 2014 2015
Over $2.5
Million
Under $2.5
Million
FIG. 2
//
Market Share By Distributor Size 2005-2015


