
JULY 2016 •
PPB
• 49
2015 PPAI
DISTRIBUTOR SALES VOLUME REPORT
cent increase over 2014. On the contrary, the smaller-company
segment saw a greater decline of -6.63 percent, with total
orders of approximately $9.3 billion.
A look by sub-segment reveals that most of the small-com-
pany categories saw a decrease in sales in 2015. The only sub-
segment that experienced positive growth included companies
with sales of $500,000 to $1 million (16.07 percent).
Companies with sales of more than $1 million to $2.5 million
had the biggest decline in sales among all sub-segments at
-20.50 percent.
What About Profits?
Much like 2014, nearly 60 percent (57 percent) of all dis-
tributors saw greater profits over the previous year, but large
distributors saw the biggest wins in profits. In this group, 78
percent indicated they enjoyed higher profits in 2015, com-
pared to 62 percent in 2014, while only 57 percent of the small
distributors did so, remaining at the same level as 2014 (57
percent in 2014). One in five small distributors saw lower
profit levels than in 2014, while a quarter experienced the
same profit level.
The Continued Rise Of Online Sales
Online sales are defined as buys resulting
from orders placed through an online store or
website. Web sales (not to be confused with
salespeople transmitting orders online) are esti-
mated to be $3,944,881,904, or 19 percent of
the industry total sales.
This category of promotional products sales
continued to grow, representing 19 percent of the
sales volume in 2015, up two percentage points
from 17.9 percent in 2014. Total online sales
grew by 10 percent over 2014 to $3,944,881,904,
solely due to an increase in online sales among
large distributors.
However, compared to 2014, the rate of
growth in online sales slowed down significant-
ly in 2015, mainly due to a significant decline
in online sales by small distributors
(-39.5 percent).
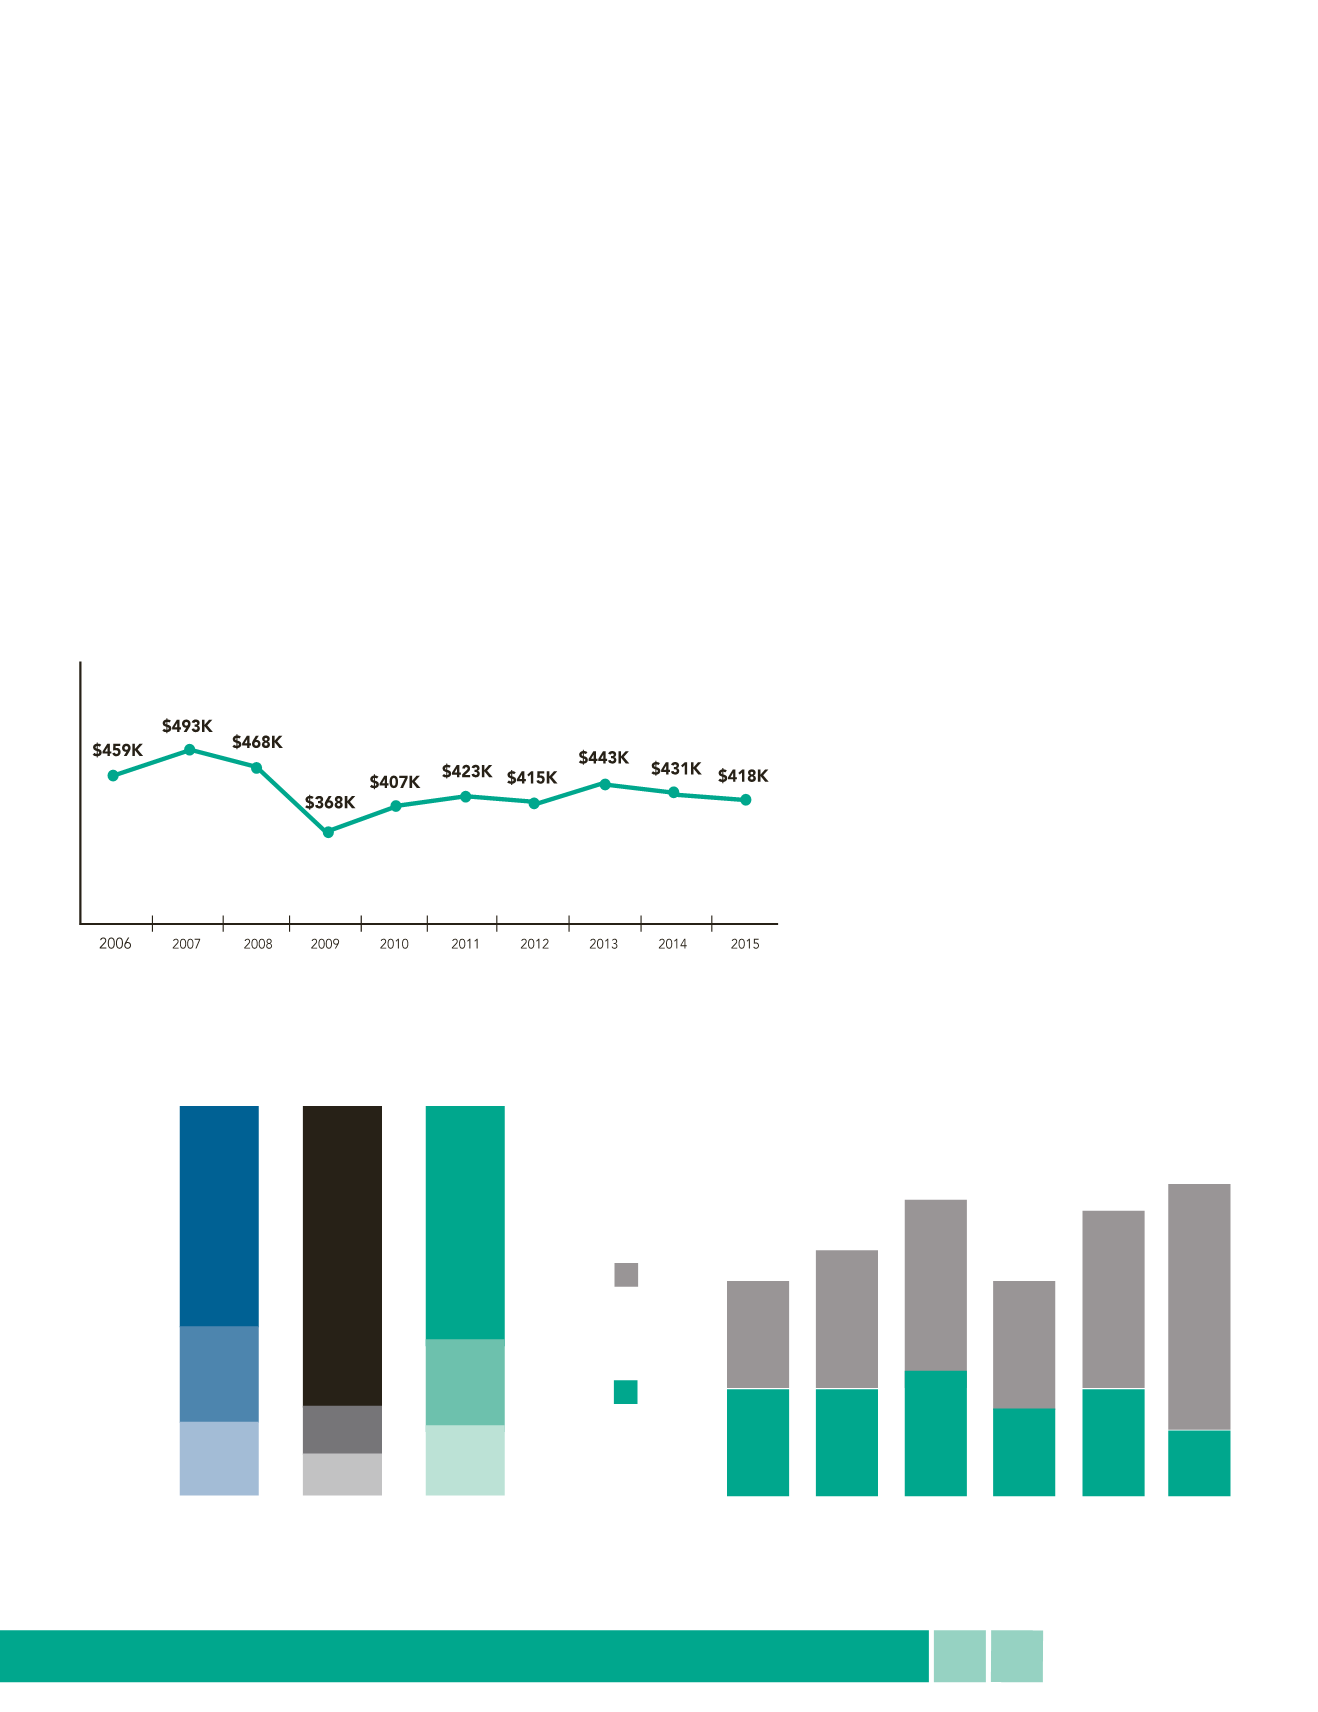
FIG. 4
//
Sales Average (Mean) By Small
Distributors (Less Than $2.5
Million), 2006 – 2015
57%
24%
19%
77%
12%
11%
60%
22%
18%
Greater
Than
2014
Same
As
2014
Less
Than
2014
Under $2.5
Million
Over $2.5
Million
All
Distributors
FIG. 5
//
U.S. Distributors’ Profit
Experience, Comparing
2014 To 2015
$1.4B
$1.4B
$2.7B
$1.8B
$1.3B
$3.1B
$2.2B
$1.6B
$3.7B
$1.6B
$1.1B
$2.7B
$2.2B
$1.4B
$3.6B
$3.1B
$0.8B
$3.9B
2010 2011 2012 2013 2014 2015
Over
$2.5
Million
Under
$2.5
Million
FIG. 6
//
Online Sales Contributions
To Distributor Business, 2010-2015


