
50 •
PPB
• JULY 2016
GROW
T-SHIRTS, GOLF SHIRTS, APRONS,
UNIFORMS,
caps, jackets, neck-
wear and footwear continued to
be the biggest category of pro-
motional products from a sales
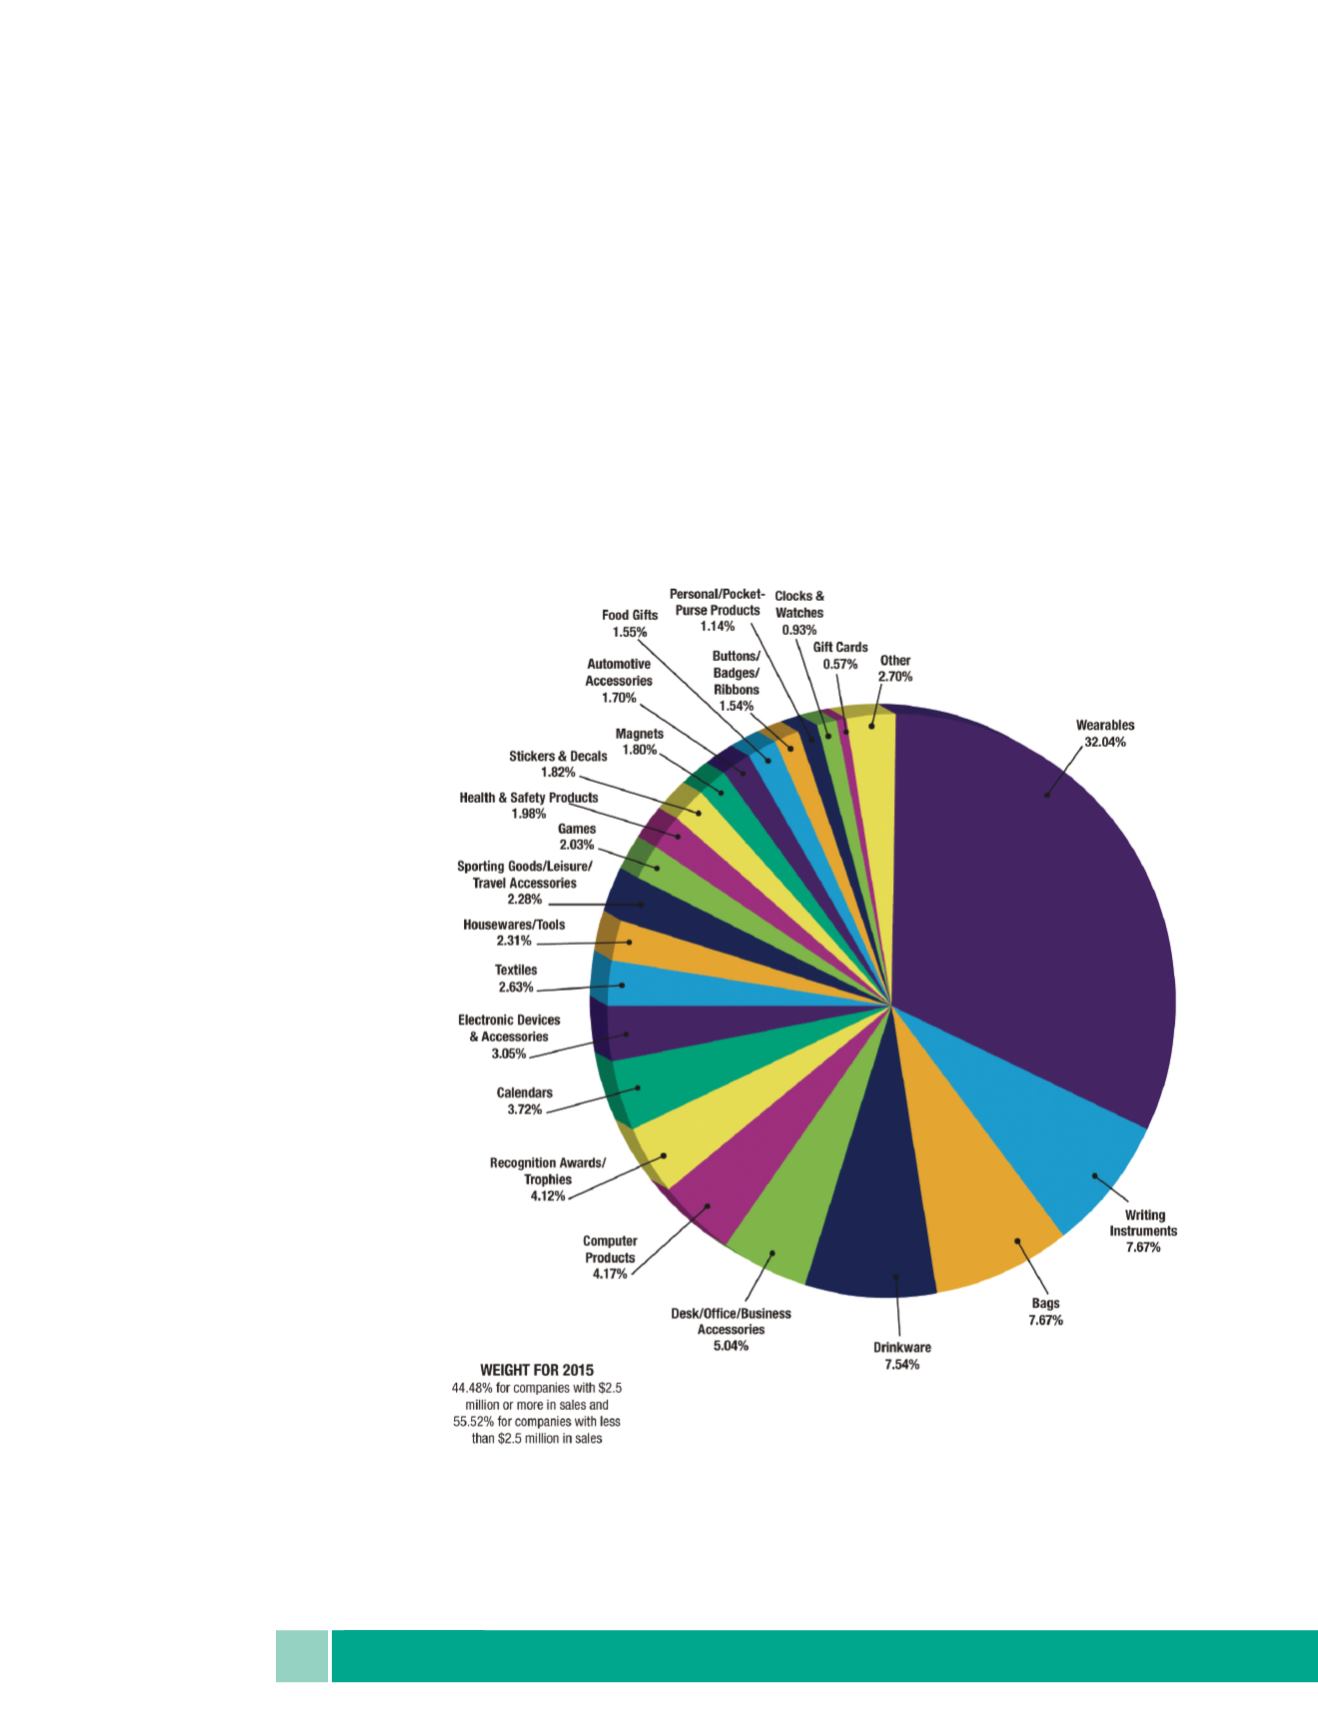
point of view with total wear-
ables sales up again last year over
2014, capturing 32 percent of the
market.
Historically, the second, third
and fourth best-selling categories
jockey for position every year
with writing instruments and
bags tying for the second spot in
2015 with 7.67 percent of sales
each, followed by drinkware at
7.54 percent, desk and office at
five percent and the remaining
product categories following at a
strong pace.
In 2015, sales in almost every
product category rose slightly
with some of the biggest gains in
desk and office products and
sporting goods, leisure and travel
accessories.
In sales by program category,
the big winner in 2015 was busi-
ness gifts at 13.37 percent fol-
lowed by brand awareness at
12.24 percent, which held the
lead in 2014 at 14.43 percent.
Employee relations and events
rose last year to 11.95 percent of
sales, a 2.27-percent increase
over 2014. In addition to busi-
ness gifts, sales for public rela-
tions programs was the big gainer
in 2015, rising from just under
five percent to 6.38 percent.
2015 Sales By Products
And Programs
2015 PPAI
DISTRIBUTOR SALES VOLUME REPORT
FIG. 7
//
2015 Sales By Product Category


