
JULY 2016 •
PPB
• 51
2015 PPAI
DISTRIBUTOR SALES VOLUME REPORT
INSIDE THE
RESEARCH
PPAI’S 2015 ANNUAL
DISTRIBUTOR SALES
Summary
resulted from an independent
email/mail survey of industry dis-
tributors (including both PPAI
members and nonmembers) con-
ducted during March – April
2016, by Relevant Insights LLC,
an independent market research
firm. In addition, a census of the
largest firms was also undertaken.
Combining the samples from
the different data collection
methods used resulted in a total
of 23,021 (22,153 small firms
and 868 large firms) distributor
surveys covering the entire U.S.
industry. Responses projected
across the entire distributor pop-
ulation combine sales for small
distributors (under $2.5 million)
and large distributor firms (over
$2.5 million) to determine the
total promotional products dollar
volume.
TAKE A DEEPER DIVE
The full report, containing 41 years of historical data, sales by company
size and more predictions for 2016, is free to PPAI members at
www.ppai.org. Click on Inside
PPAI and then on Research.
Michaela Mora is principal of Relevant Insights, LLC. Tina Berres Filipski is editor of
PPB
.
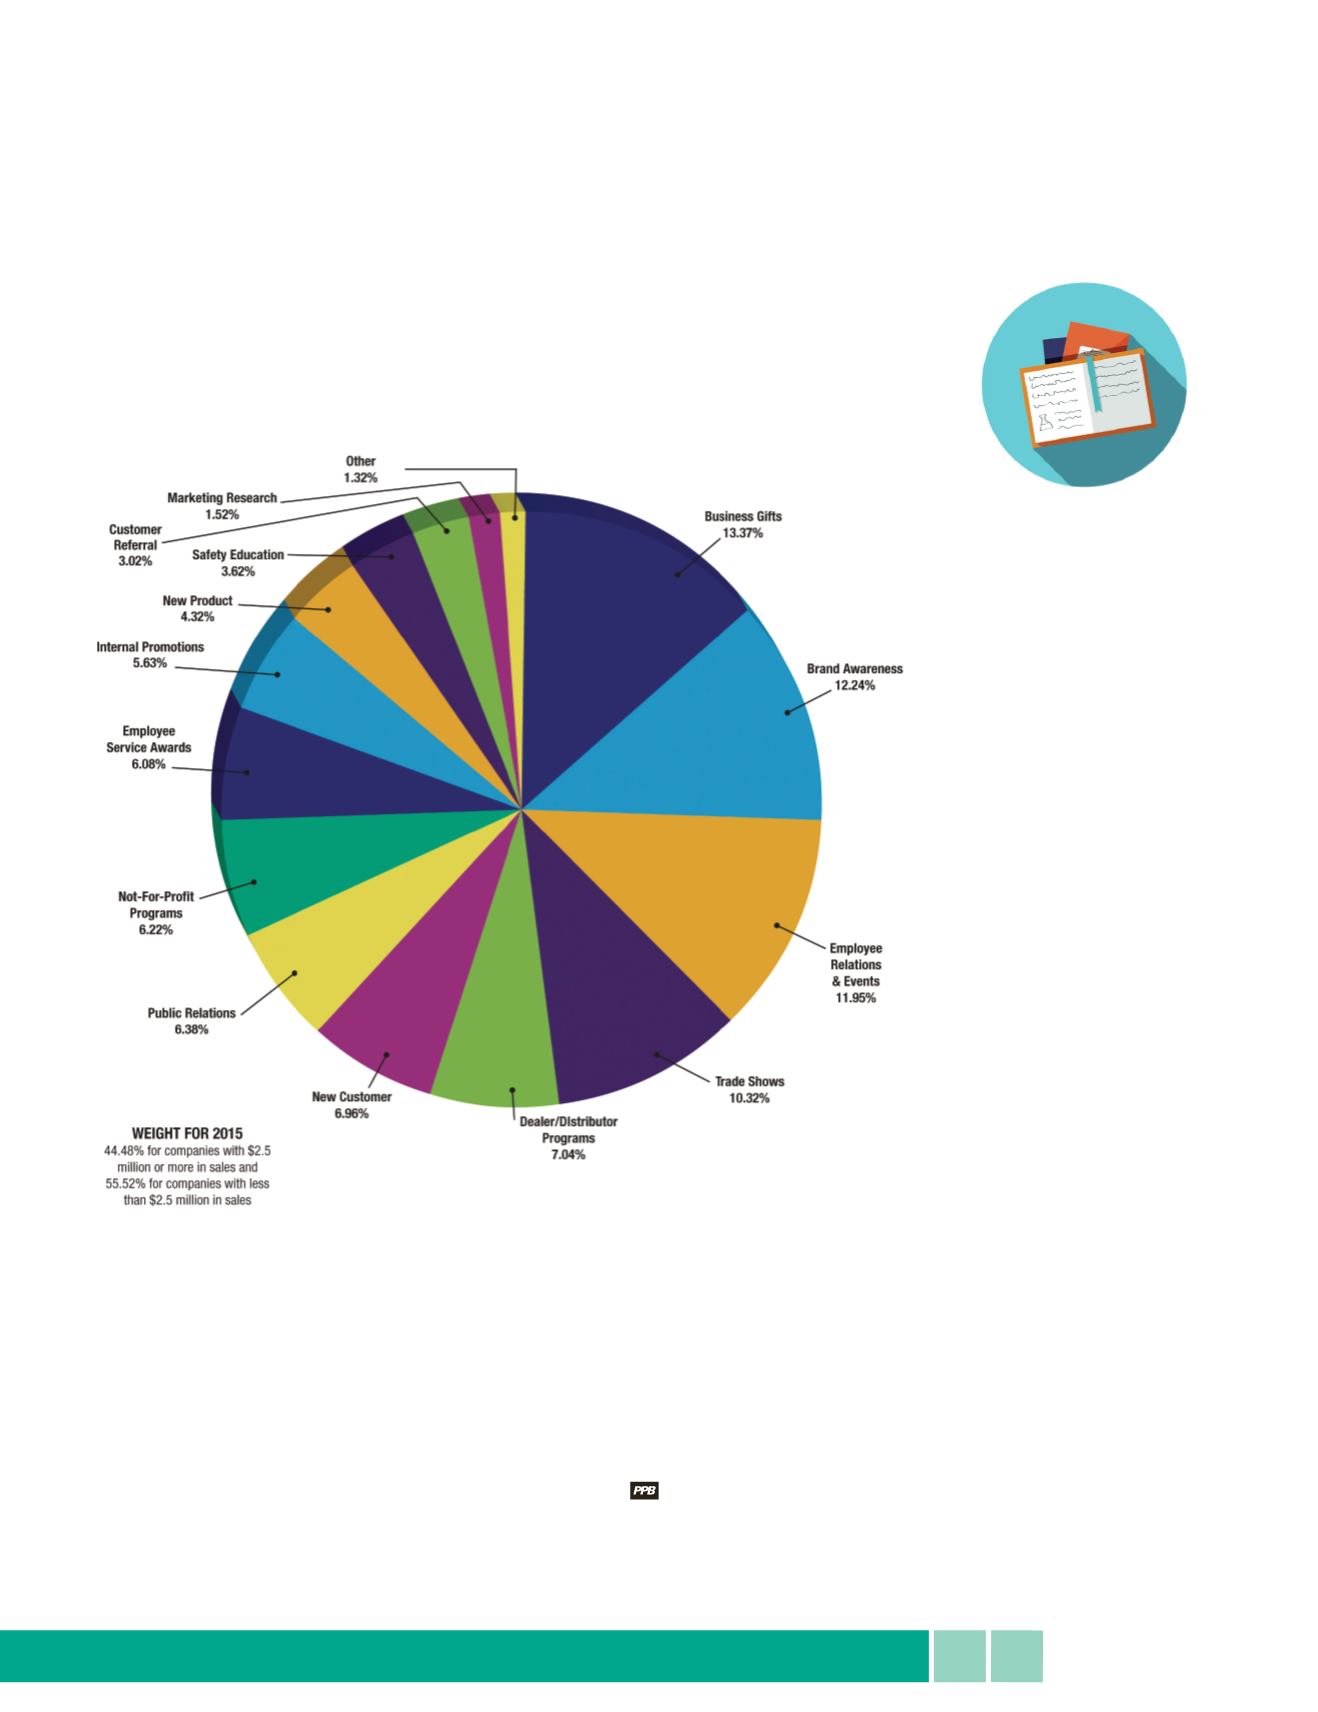
FIG. 8
//
2015 Sales By Program Category
Responses to questions about product and program categories continue to be a challenge as many distributors do not keep
track of their sales by these categories. In order to continue building on the established research, PPAI urges new entrants to the
industry and established distributors to keep track of their sales by PPAI’s product and program categories shown in this summary.


