
82
|
JUNE 2017
|
FEATURE
|
PPAI Exclusive Research
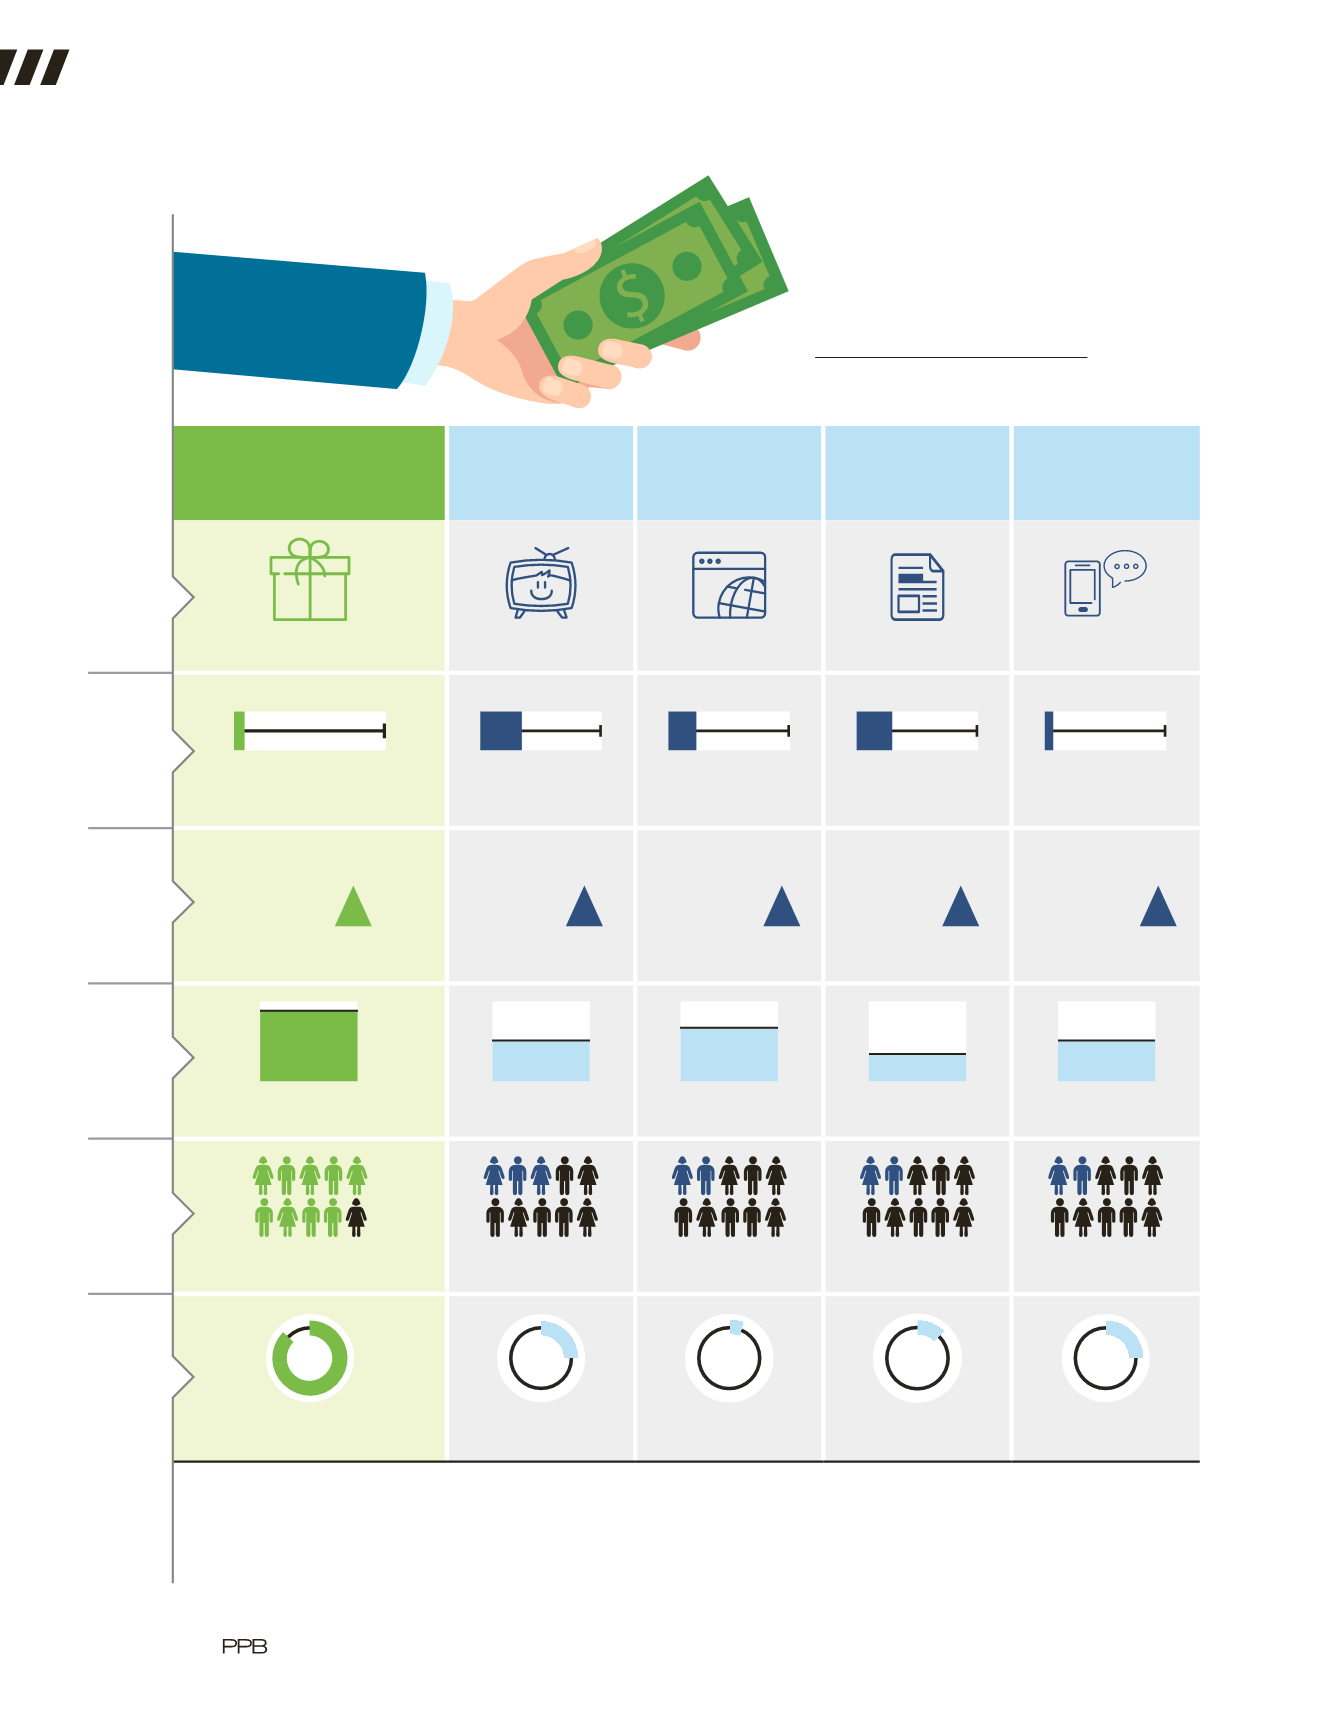
2017 Ad Map: A Comparative Analysis
PROMOTIONAL
PRODUCTS
Business Gifts,
Giveaways, Incentives
BROADCAST
TV, Video, Cinema,
Product Placement
ONLINE
Desktop Internet,
Email, Social Media
Magazines, Newspaper,
Direct Mail
MOBILE
Messaging, Applications
SALES
VOLUME
$20.8
BILLION
$103.4
BILLION
$67.8
BILLION
$84.9
BILLION
$20.7
BILLION
MARKET
SHARE
7%
34% 23% 29% 7%
GROWTH
RATE
+ 4%
+ 3%
+ 18%
+ 1%
+ 66%
REACH
89%
61% 73% 48% 61%
RECALL
9
in 10
3
in 10
2
in 10
2
in 10
2
in 10
REACTION
83%
17%
6%
12%
17%
1. “Mapping Out The Modern Consumer”
2017 Consumer Study
(PPAI Research, Dec 2016).
2. Marketing Charts,
Advertising Channels with the Largest Purchase Influence on Consumers Study Advertising
Channels with the Largest Purchase Influence Study
. 3rd Annual Edition (May 2016).
3. Dr. Richard Alan Nelson and Rick Ebel, “Promotional Products Spend In 2015 Ranked Sixth Among All Media: PPAI Distributor Sales Volume Report” (
PPB
Magazine, July 2016).
4. Relevant Insights, “2015 Annual Distributors’ Promotional Products Sales: Detailed Findings And Analysis”
2015 Sales Volume Study
(PPAI Research, June 2016).
© 2017 Promotional Products Association International. PPAI Research
TM
. All rights reserved.
$
297.6
BILLION
2015 U.S. Advertising Sales
since 2014
since 2014
since 2014
since 2014
since 2014


