


 81 / 116

|
JUNE 2017
|
79
more intrusive today compared to two
or three years ago, and 87 percent agree
there are more ads in general. They are
making decisions in everyday life that
revolve around whether they will be
interrupted by unwanted distractions,
such as paying for ad-free services. For
example, Netflix users grew to nearly
94 million earlier this year and music
streaming subscriptions have surpassed
100 million users. In fact, according to
a recent study, 42 percent of consumers
said they were “planning to pay for new
solutions to remove ad interruptions”
within the next year. And the desire to see
fewer ads is motivating these purchases.
Earlier this year, PaigeFair reported that
mobile ad-blocking software has grown
to an estimated 380 million users and 236
million active desktop devices, indicating
“interruption” as the leading reason for
consumer use. PaigeFair also reported
a staggering 74 percent of consumers
will abandon websites that require them
to disable their ad-blocker software.
An evolving challenge for marketers
is overcoming ad-blocking in order to
successfully connect with the target
audience. Yet ad-blocking behaviors are
symptoms rooted in a larger problem:
consumers no longer enjoy their
advertising experiences. Despite this
growing pattern of ad avoidance that we
see among consumers today, 83 percent
agree that not all ads are bad but “they
want to filter out the really obnoxious
ones,” as one report stated. They want
messages to catch their eye and clearly
deliver a message that they can relate
to and makes them think. (
Figure 3
).
As Benjamin Franklin famously said,
“Every problem is an opportunity in
disguise.” Rather than forcing more
unwanted advertising on consumers,
it is time to reinvent how marketers
communicate their messages. Following
the release of a new consumer
study
earlier this year, PPAI has published the
2017 Ad Map presenting a comparative
analysis across brand touchpoints. These
are grouped into five advertising channels
(
Figure 4
) to better examine and compare
the role each plays with consumers.
Armed with this knowledge, marketers
can make more informed decisions
about where to invest their advertising
budgets and grow their businesses.
Promotional product reach is measured
by consumer ownership. It is simply
the percentage of consumers who have
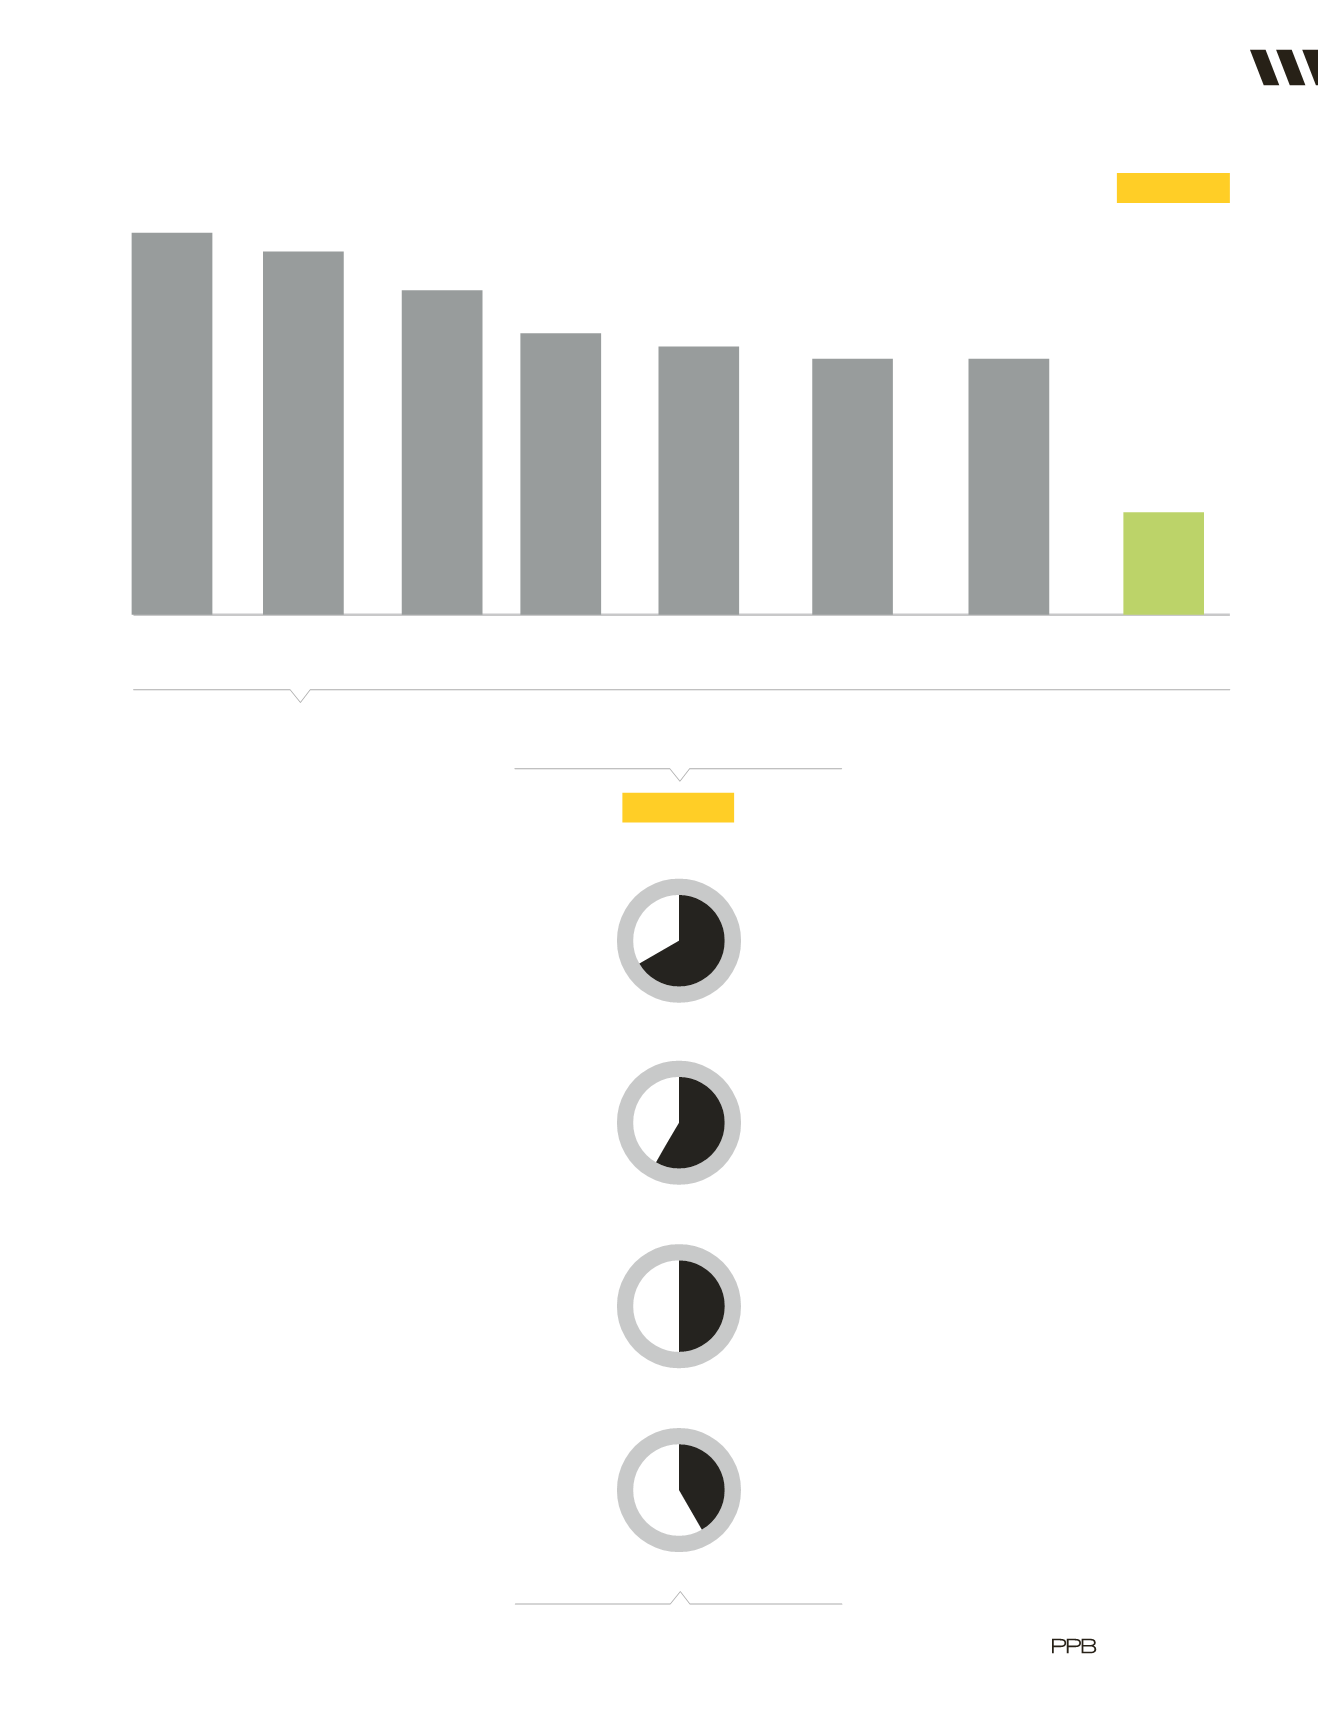
Figure 2.
Consumer Actions Taken On Ads In Past Six Months
SKIP ONLINE
VIDEO ADS
CLICK OUT OF
DIGITAL ADS
NEVER OPEN
UNSOLICITED MAIL
DISCARD PROMOTIONAL
PRODUCTS
SKIP A
MAGAZINE AD
UNSUBSCRIBE FROM
EMAIL MARKETING
CHANGE RADIO STATION
DURING COMMERCIALS
CHANGE CHANNEL DURING
TV COMMERCIALS
68
%
66
%
57
%
50
%
48
%
46
%
46
%
20
%
Figure 3.
Advertising Qualities
Visually Appealing
65%
Clear & Concise
60%
Personally Relatable
47%
Thought Provoking
41%
PPAI Exclusive Research
|
FEATURE