
Internal sales meetings most often occur monthly or
weekly. Seven years ago, 42 percent held weekly sales
meetings and only 30 percent monthly, so there is a
slight shift. In 2008, 14 percent reported holding annu-
al meetings, marking a six-percent drop. It is interest-
ing to note that in 2011, 56 percent did not conduct
sales meetings compared to the 45 percent today.
This reveals a 10-percent increase in businesses that
conduct sales meetings overall.
58 •
PPB
• MARCH 2016
GROW
DISTRIBUTOR BUSINESS STUDY
The PPAI Expo, traveling shows and regional shows
are the events most attended on average by distribu-
tor companies. The least attended on average are pre-
mium or incentive shows and customer or end-user
shows. Principals report they are most likely to attend
most industry events, but sales representatives often
also accompany the principal when supplier reps or
multi-line reps visit.
INDUSTRY EVENTS:
WHO ATTENDS?
SALES MEETINGS
45
PERCENT
said they do not hold
sales meetings
SPECIAL
SERVICES
Special services can vary if offered in-house or out-
sourced to other companies. In many cases, the majority
of respondents agree on where the service is offered,
however some services can be offered in-house and
outsourced. In-house services most often mentioned
included engraving, sublimation and heat press. Direct
to Garment (DTG) printing and large-scale fulfillment
were the most-mentioned outsourced services.
IN-HOUSE VS. OUTSOURCED
Mo Das is PPAI’s market research coordinator; Tina Berres Filipski is editor of
PPB
.
When to charge clients a fee in addition to the cost of merchandise:
CREATIVE SERVICES
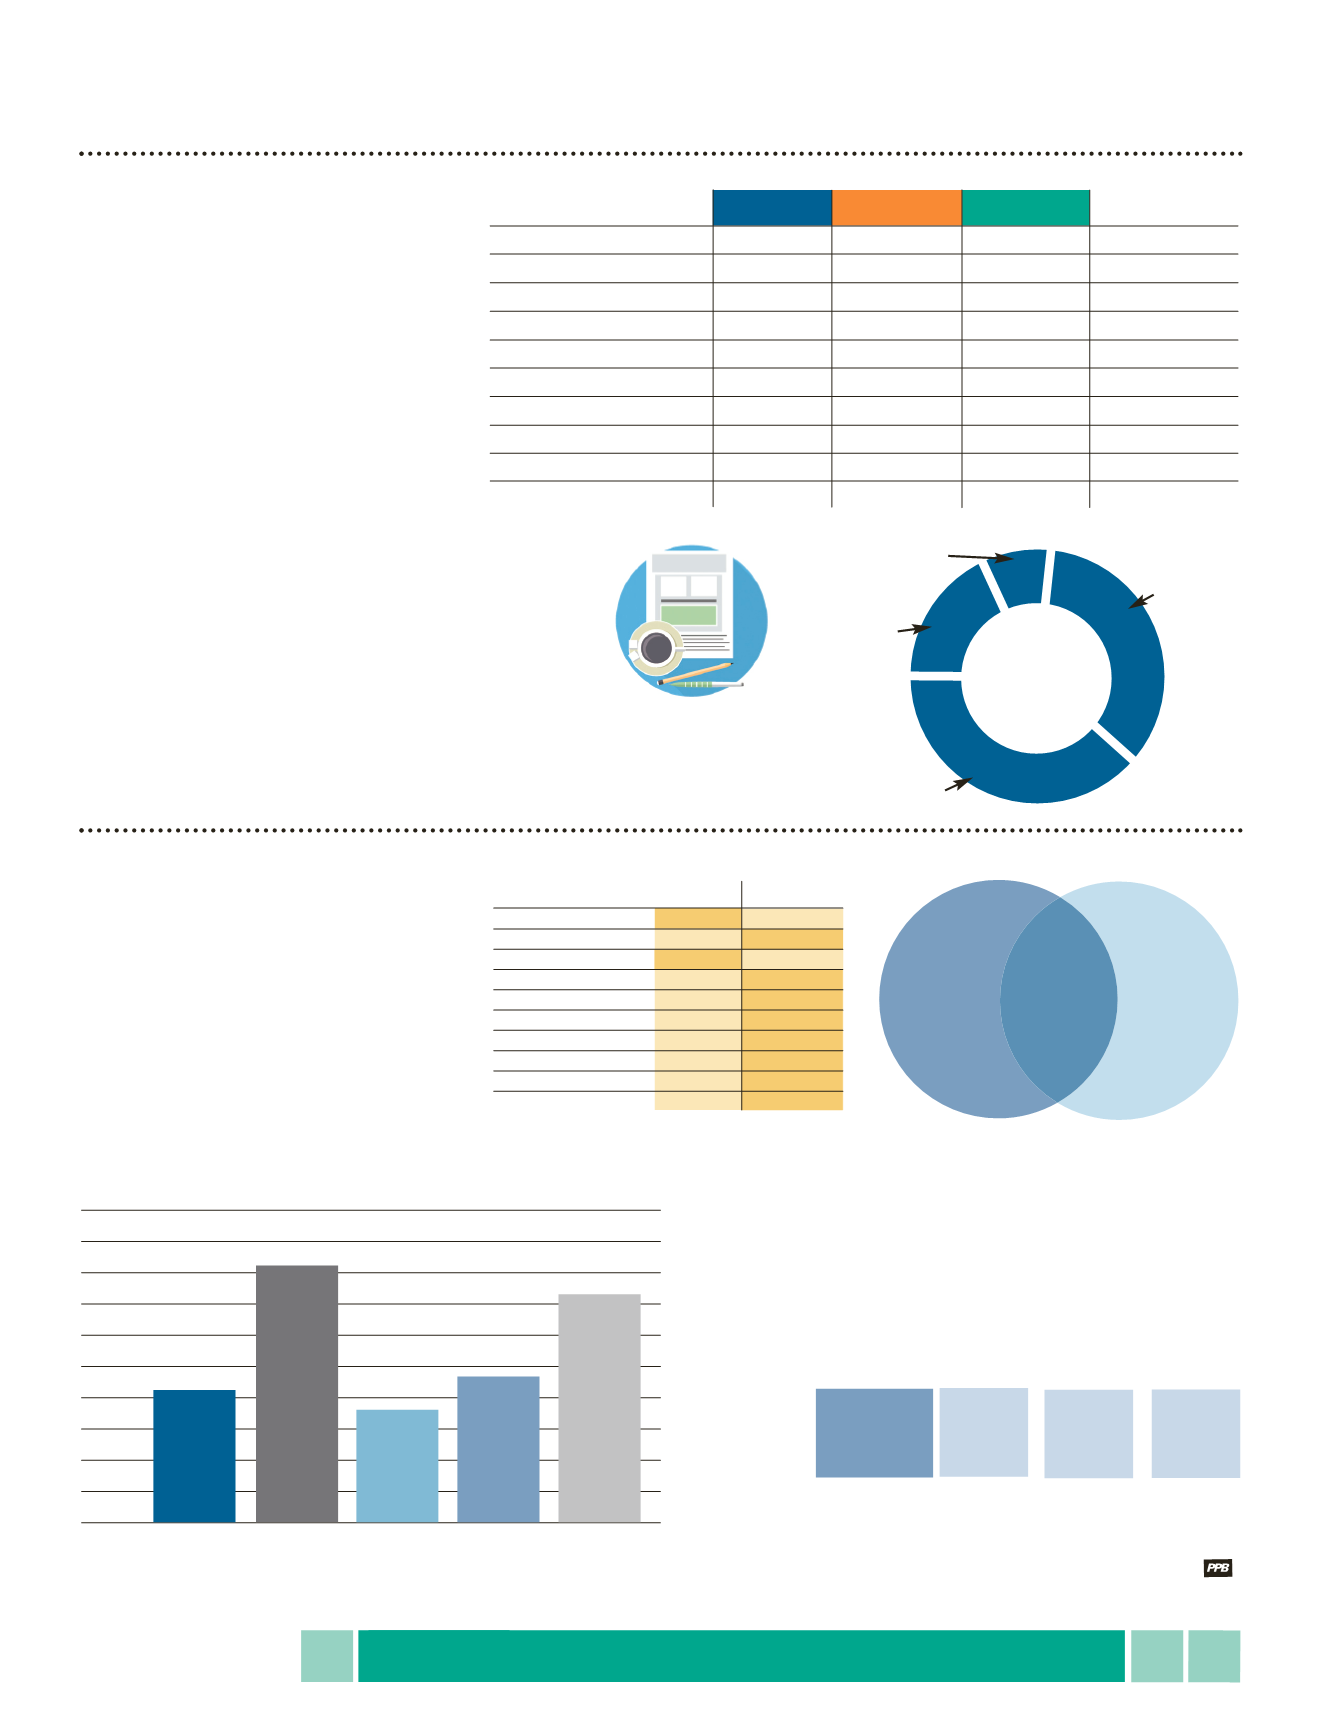
Today, 57 percent of the distributors say they have sold at least one of the pro-
grams listed in the table (left), which is a three-percent increase in four years (54
percent in 2011). Since 2008, there has been a 16-percent jump in the number of
co-op programs and an 18-percent increase in company stores. Today, company
stores and fulfillment programs are the most popular among distributors.
PROGRAMS SOLD
38%
37%
17%
8%
FREQUENCY
OF THE
55 PERCENT
WHO DO
HOLD SALES
MEETINGS
WEEKLY
MONTHLY
QUARTERLY
ANNUALLY
IN-HOUSE OUTSOURCED
artwork
65%
57%
imprinting 23%
80%
layout/paste-up 58%
32%
copywriting 33%
35%
screenprinting 15%
84%
online company stores
32%
38%
printing 14%
79%
fulfillment
33%
46%
packaging 30%
48%
embroidery
13%
83%
packaging
fulfillment
online company
stores
copywriting
artwork
imprinting
screen printing
printing
embroidery
layout/paste-up
heat press
sublimation
engraving
IN HOUSE
OUTSOURCED
50%
45%
40%
35%
30%
25%
20%
15%
10%
5%
0%
CO-OP
PROGRAMS
21%
COMPANY
STORES
41%
SALES
PROGRAMS
18%
INCENTIVE/
SAFETY
PROGRAMS
23%
FULFILLMENT
PROGRAMS
36%
31
PERCENT
do not charge a fee for creative services
ALWAYS
16%
IF CLIENT
USES IDEA
BUT DOES
NOT ORDER
8%
OTHER
3%
SOMETIMES
73%
distributorship
principals
sales reps
office staff
does not attend
PPAI Expo
54%
18%
4%
24%
traveling shows
36%
27%
7%
30%
regional shows
39%
29%
8%
24%
premium/incentive shows
15%
13%
1%
71%
ASI shows
27%
14%
5%
54%
internal sales meetings
8%
24%
8%
60%
customer/end-user shows
14%
13%
2%
71%
supplier rep/MLR visits
21%
26%
7%
46%
supplier webinars
29%
20%
5%
46%
industry education events
30%
21%
2%
47%
GENERAL
BUSINESS PRACTICES


