
MARCH 2016 •
PPB
• 55
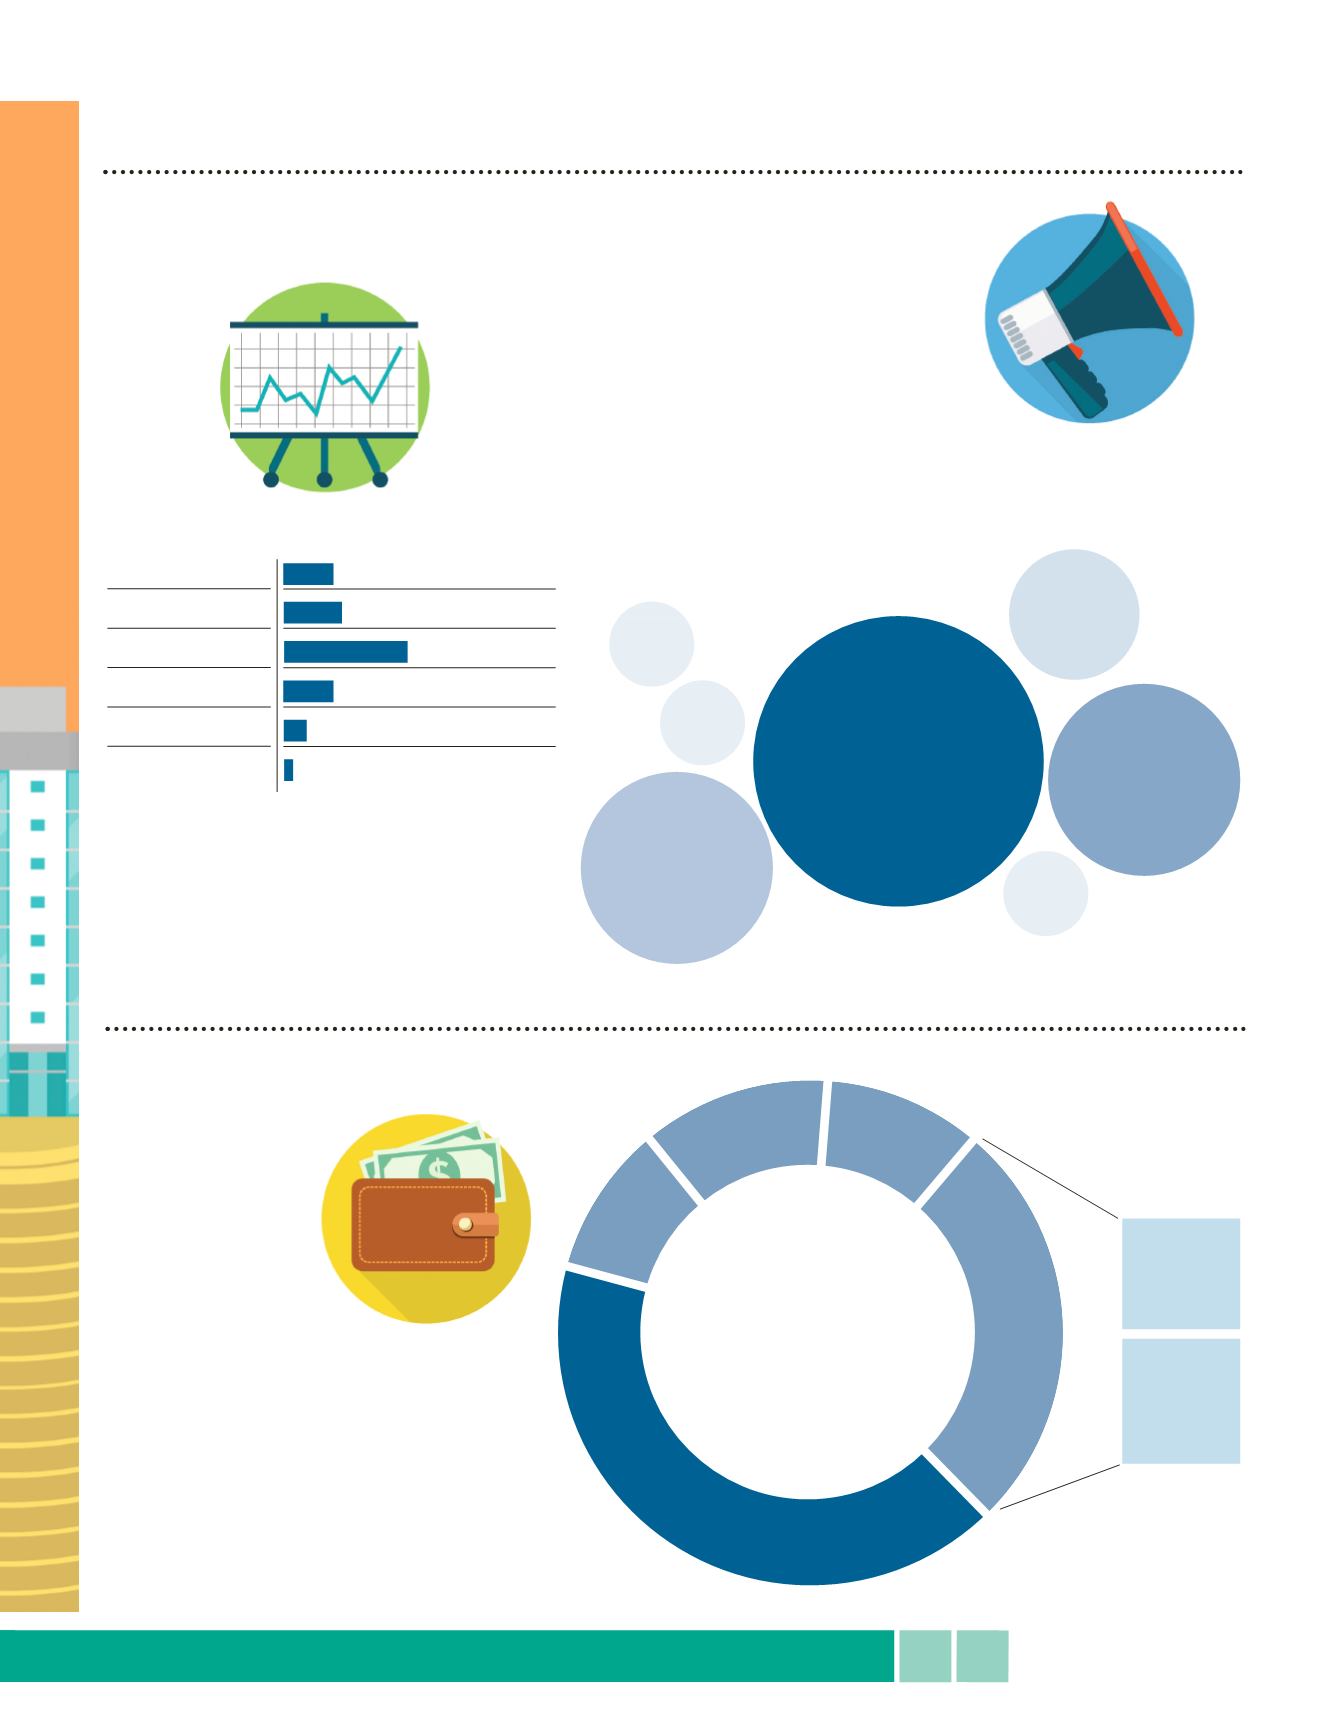
AVERAGE SALES VOLUME PER SALESPERSON
Under $50,000
$50,001 - $100,000
$100,001 - $300,00
$300,001 - $500,000
$500,001 - $1M
Over $1M
18%
20%
29%
18%
10%
4%
The bulk of the industry’s average sales revenue per salesperson
ranged between less than $50,000 to $500,000. The majority
generates between $100,001 and $300,000. In 2011, only one
percent of salespeople averaged over $1 million in annual sales.
In just four years, that number has increased by three percent,
which suggests a one-percent annual increase
RECRUITMENT SOURCES
Those that do recruit most likely rely on referrals (84 percent) and some use networking groups
(34 percent). “When I meet someone who is the right personality, I offer them an opportunity,”
said one respondent. “But they are hard to find.”
The majority (44 percent) reported ‘catalog minimum’ as
the minimum order size for a commission payment. Ten
percent said the minimum was between $100 and $249,
and eight percent said the minimum order size for commis-
sion payment was either above $250 or up to $99. Of the
30 percent who reported ‘other,’ more than half specified
this as ‘not applicable’ (16 percent).
58
PERCENT
of distributor businesses say
they do not recruit salespeople.
REFERRALS
84%
SOCIAL
MEDIA
25%
NETWORKING
GROUPS
34%
AGENCY
19%
MULTI-LINE
SUPPLIER REPS
16%
NEWSPAPERS
12%
ONLINE JOB
BANKS
16%
30%
44%
8%
8%
10%
CATALOG
MINIMUM
UP T0 $99
$100-$249 $250 OR
MORE
OTHER
COMMISSION STRUCTURE
NON-
APPLICABLE
16%
OTHER
14%
DISTRIBUTOR SALES
TEAM PROFILE
COMPENSATION


