
Digital Dining
Smartphone-savvy consumers
are more likely to use restaurant
tech options to get their grub
on. Twelve percent of Millennial
diners order takeout or delivery
at least once a week through
restaurant apps, compared to
just eight percent of Baby
Boomers. But both generations
pay for meals via a smartphone
app at least once a week in equal
proportion—10 percent.
Source: National Restaurant
Association
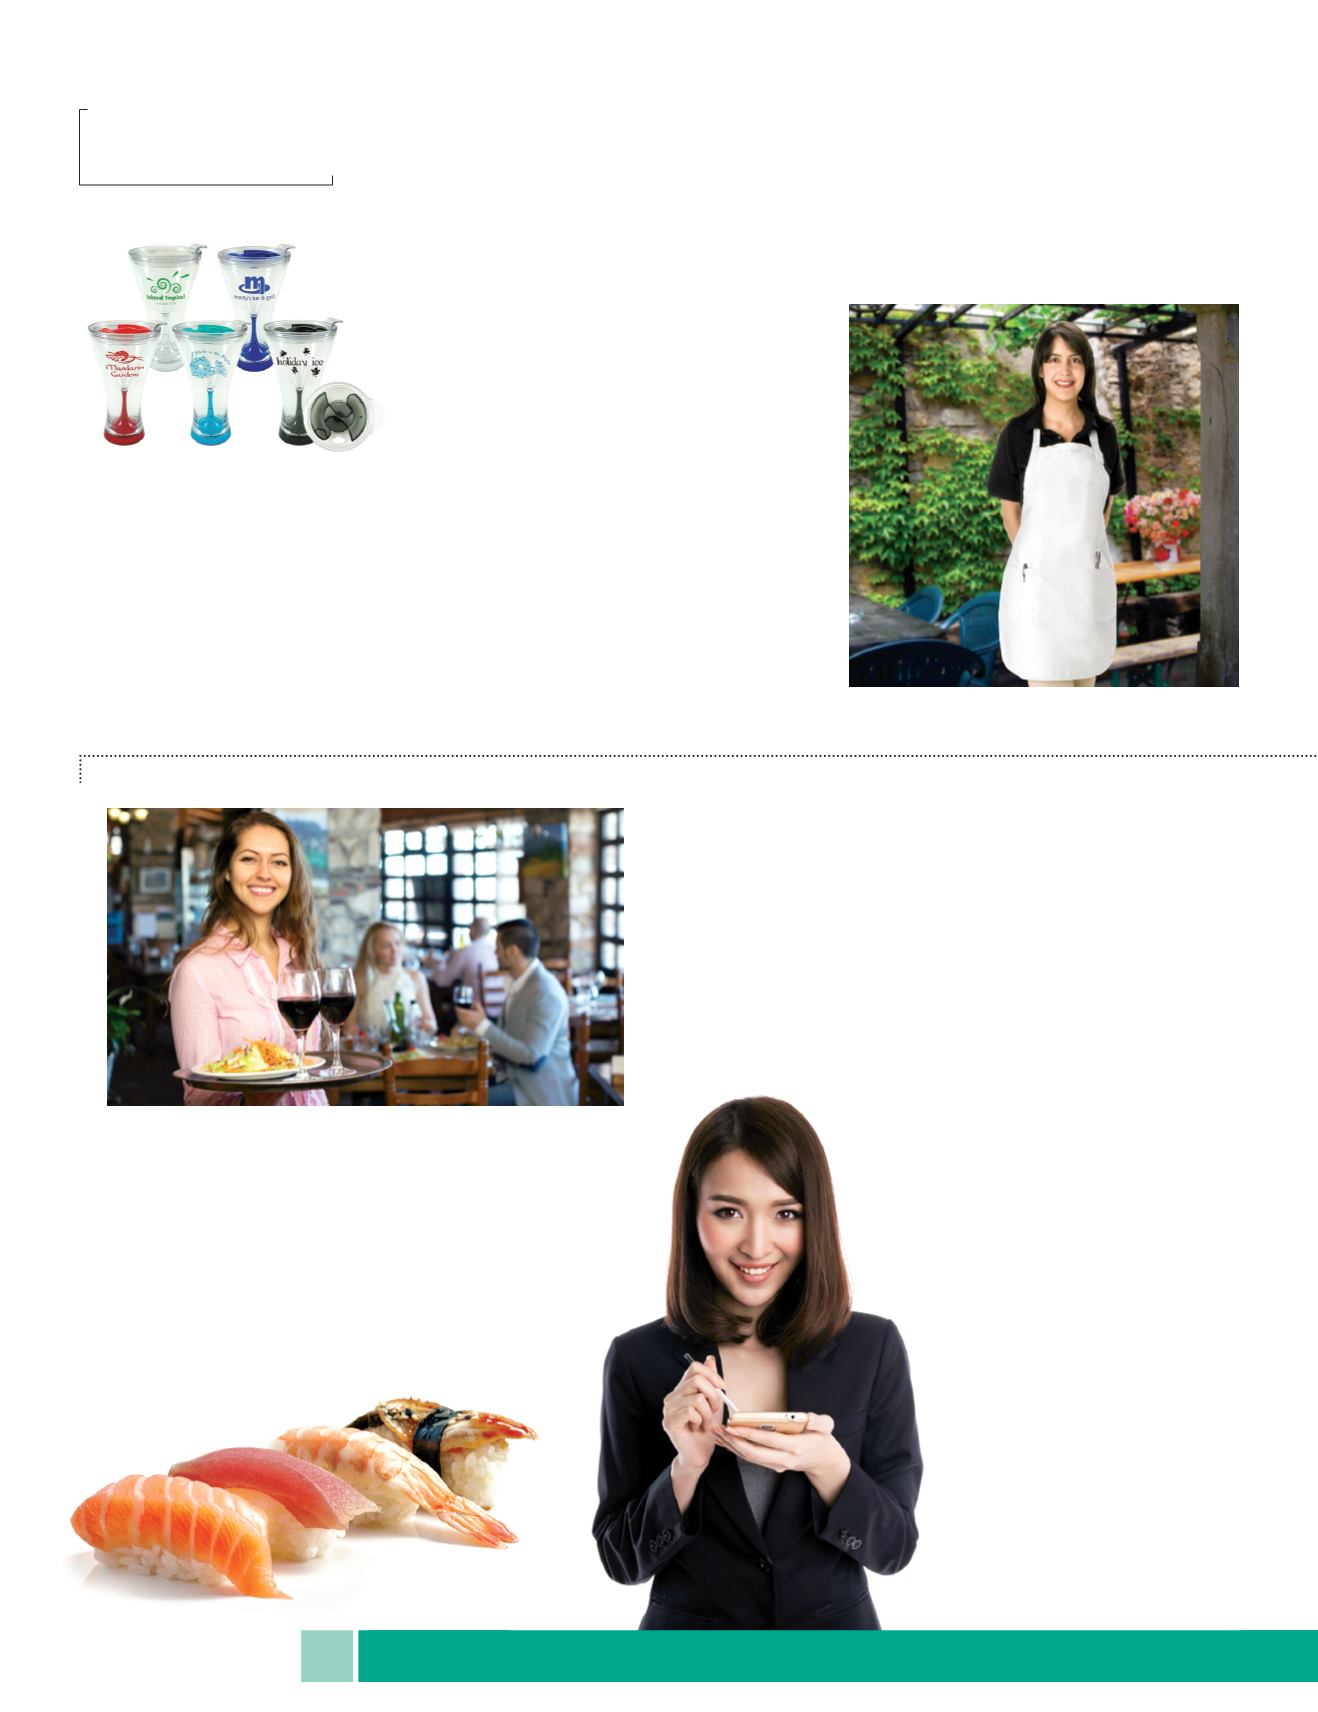
Exploring the world, one plate at a time
Americans love ethnic cuisine. Three in five consumers
consider themselves worldly diners, while two-thirds
report eating a wider variety of cuisines than they did
five years ago. Diners prefer to go out for sushi, Thai,
Vietnamese, Brazilian/Argentinean, Greek and
Southeast Asian; for dining in, they prefer to order
Chinese, Mexican or Italian for takeout or delivery.
MARKET TO MARKET
42 •
PPB
• FEBRUARY 2016
GROW
Outfit restaurant staff with a full-length 22-inch-by-
30-inch
apron
that’s adjustable at the neck and fea-
tures two seven-inch patch pockets, as well as 24-
inch waist ties. The 45/55 poly-cotton twill apron
comes in white, natural, black, forest green, red,
navy blue and royal blue.
Aprons, Etc.
UPIC: APRONS
www.apronsetc.comToast to a great giveaway promotion with
the BPA-free
Manhattan double-wall tum-
bler
. It features a slider lid and holds seven
ounces covered, or 10 ounces uncovered.
Choose from aqua, blue, clear, red or
smoke, and add a single-color imprint.
Crown Products, Inc.
UPIC: CROWNPRO
www.crownprod.comAmerica’s Appetite
IN 2015, ONE MILLION RESTAURANT locations employed
roughly 14 million people—10 percent of the nation’s work-
force—and recorded just over $709 billion in sales in 2014.
(That’s four percent of U.S. GDP!)
In 2015, the top states for restaurant growth were Arizona,
Florida, North Dakota, Texas and Colorado.


